
College Greek Life Report Card

A Survey of Greek-Letter Organizations Assessing Freedom of Association and Speech at U.S. Colleges and Universities (Download a PDF copy of this report.)
Executive Summary
The topics of freedom of speech and freedom of association on college campuses have received much attention in recent years. Many college administrators have enforced new rules and adopted new language with the aim of creating more inclusive campus environments. They believe that these new procedures protect students and advance equity for underrepresented groups. On the other hand, critics of these changes say that colleges are being transformed into enclaves characterized by groupthink, intimidation, pseudo-language, and censorship. They believe that speech codes and restrictions on voluntary student associations are offered in bad faith by actors who prioritize political aims over the well-being of college communities. Finally, there are others who think that the debate taking place between these two factions lacks nuance, or is entirely overblown.
Meanwhile, as the debate over free speech on campus rages, a parallel debate over the rights of students to gather in voluntary organizations on campus is unfolding both in the media and in the courtroom. In 2020, Harvard University retreated from a policy that penalized single-sex clubs and organizations after two federal court rulings indicated that Harvard’s policy could be viewed as discriminatory. And in March 2021, the U.S. Supreme Court ruled that University of Iowa officials could be held personally liable for barring a student religious group that ran afoul of the university’s rules on non-discrimination. Yet, tension remains at many colleges and universities between the legal right of students to form voluntary groups on the basis of sex, religion, or ideology, and the desire of many academic leaders to promote inclusivity on campus.
RealClearEducation wanted to cut through the noise of the debate over campus speech and association and direct these questions to students. To this end, we decided to survey students who belong to voluntary student associations—in this case, Greek-letter organizations. RealClearEducation commissioned the opinion research firm Slingshot Strategies to gauge quantitatively the distribution of opinions of fraternity and sorority members on college campuses. A total of 4,620 college students, comprising 1,805 fraternity members and 2,815 sorority members from more than 500 colleges and universities located across 36 states, responded to an online questionnaire between June 1 and September 1, 2020. This time frame coincided with the COVID-19 pandemic, allowing us to capture the impact of the pandemic on students. It also coincided with a historic wave of protests, violence, and racial tension in many American cities, and this context almost certainly affected how students responded to questions about racial topics in this survey. All students who participated were members of a fraternity or sorority and were enrolled at a college or university during the spring semester of 2020. Access to these students was not conditioned on any terms set by the universities. Students were asked questions in four basic categories:
COVID-19: the impact of the pandemic on their academic, professional, and personal lives
Fairness and Favorability: the manner in which they believe that their fraternity or sorority is viewed by the broader campus community and treated by administrators
Organizational Freedoms: the degree to which their university restricts the self-organization of students into groups of shared interest
Personal Freedoms: the degree to which political and personal views—particularly, unpopular or controversial ones—can be expressed freely and honestly
The subset of students who currently hold, or in the past held, leadership positions in their fraternity or sorority received an additional questionnaire relating to these capacities (41% of respondents held leadership positions at the time they were surveyed, and 15% held them in the past).
For the purpose of context, 46% of the students who participated in this survey identified their overall political views as liberal; 33% identified as conservative.
Key Findings—COVID-19
• 93% of students report that COVID-19 has had a negative impact on their college experience, with 42% of students reporting a severe negative impact.
• During the period of the survey (June 1–September 1, 2020), only 6% of students reported living in on-campus housing and 22% in off-campus housing; 59% lived with their parents or family; and 9% lived in fraternity or sorority housing.
• Students experienced a multitude of disruptions in their academic and professional lives due to COVID-19. Those most commonly reported: being forced to leave on-campus housing (51%), loss of a current job (29%), and an inability to contact professors (23%).
• While navigating the disruptions of the pandemic, students relied on a broad network for finding jobs, internships, and career opportunities. We allowed students to select several options, and they reported the following:
“Which of the following have you relied on for jobs, internships, and career opportunities?”
|
Resource |
Sample percentage who relied upon resource |
|
My parents and family |
56% |
|
Friends and peers from my college or university |
42% |
|
Friends and peers from my hometown |
38% |
|
My current employer and coworkers |
38% |
|
Professors and faculty |
31% |
|
Members of my fraternity or sorority |
31% |
|
My campus career office |
30% |
|
Alumni of my fraternity or sorority |
18% |
|
Other |
3% |
|
None of the above |
9% |
Students’ responses to the next three sections of the survey were used to assign a grade from zero to 100 to each school. It is important to note that the number grade received by a school is not a measure of performance or faithfulness to free-speech principles based on an objective standard. Rather, it is a cumulative reflection of how students at that school feel (insofar as they are represented by the sample polled). In other words, the method by which students’ answers to poll questions are transformed into an overall “grade” is objective, but the answers themselves are subject to students’ prejudices, discomforts, or subjective views.
The procedure by which number grades were calculated is described in detail in the “Detailed Methodology” section. For schools from which at least 10 students responded to the survey, number grades were translated into letter grades. There were 153 schools that received a letter grade out of the sample of 534, and the procedure by which letter grades were assigned is discussed in the “Letter Grade Rankings” section. All comparisons between schools, or groups of schools (e.g., the discussion of student body size, public vs. private, and geographic location) considered only this subset of 153 schools because of concerns over an insufficiently large sample size for the others.
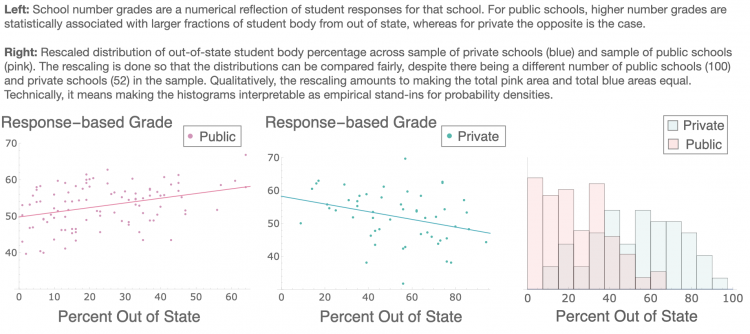
We found that key determinants of student views toward free speech on their campus lie in the composition of the student body itself: the out-of-state share of students and the racial composition of students, in particular, affect how students understand the speech environment at their school. Interestingly, these factors behave differently at public and private universities. As groups, private schools and public schools perform comparably to each other in terms of overall number grade (mean number grades of 52 and 53, respectively). We sought to further test the degree of dependence between number grade and factors such as student body size, demographic composition, and out-of-state student body percentage. However, since these characteristics vary differently across private schools from how they do across public schools (e.g., private schools tend to have smaller student bodies), correlations needed to be evaluated separately for the set of public schools and the set of private schools.
The first significant correlation that we found was out-of-state student share. At public colleges, a larger share of out-of-state students correlates with higher student evaluations of their campus speech environment. However, at private colleges, a larger share of out-of-state students correlates with lower student evaluations of their campus speech environment. Possible explanations for this include the greater power and desire of private college administrators to enforce a more distinct ethos, viewpoint, or prevailing religious or political attitude on their campus than their counterparts do at public colleges. Put simply, students who move across the country to attend a public college seem less likely to encounter an environment that they feel limits their speech and organizational freedoms than a student who moves across the country to attend a private college.
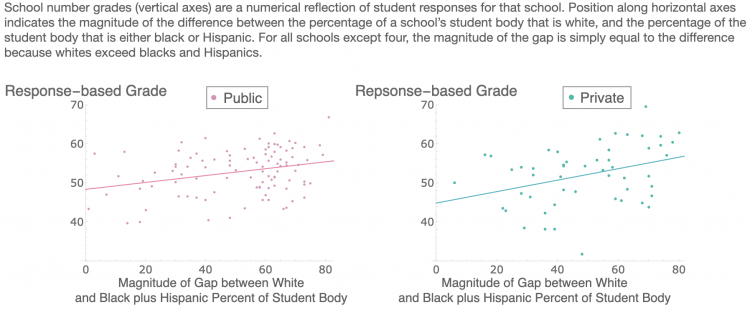
The next significant correlation we found was the racial composition of the student body—specifically, the gap between the share of white students and the share of black and Hispanic students on a given campus. This correlation was more or less consistent across both public and private colleges, where students at more racially balanced schools report a more difficult campus speech environment, while students at less racially balanced schools rate their campus speech environment more positively. This result may be unsurprising, given that students report race as the topic most “difficult to have an open and honest conversation about on your campus” and considering the timing of this survey, during 2020’s national conversation around race.
While students seem to evaluate their campus speech environment in correspondence to the composition of the student body, they lay blame for negative experiences at the foot of professors and campus administrators. In short, negative perceptions of campus speech environments originate in the student body makeup but are actualized by the faculty.
Key Findings—Freedom of Speech
• Students distinguished between different freedoms. For example, 60% of students said that they felt comfortable discussing a controversial topic with their classmates, outnumbering those who said that they felt uncomfortable by a margin of 21 points. However, when asked how they would feel about publicly disagreeing with a professor, the ratio reversed: 38% comfortable vs. 60% uncomfortable. The margin by which discomfort exceeded comfort widened to almost 30 points (67% vs. 29%) when students were asked about hypothetically expressing an unpopular position on social media under an account identifying them by name.
• Interestingly, number grade correlates positively with the out-of-state student percentage of the student body for public schools, whereas it correlates negatively for private schools. The Pearson correlation coefficients are +.36, and -.33, respectively (with corresponding p-values of 2.5 x 10^(-4) and 0.018). In other words, geographic diversity is associated with more positive student evaluations regarding freedom of speech on campus for public schools, but more negative evaluations for private schools. Scatter plots for each, along with best-fit lines, are pictured below. The slopes of the lines are +.13, and -.12, respectively. Histograms showing how the out-of-state fraction of the student body is distributed across public and private schools are shown in the rightmost plot.
• An additional finding of this study is that one of the more predictive factors associated with response-based number grades is the racial composition of the student body. For public as well as private schools, a more racially homogenous student body (which, in all but four cases, is synonymous with a whiter student body) is associated statistically with higher response-based number grades. In other words, students’ evaluations of free speech on their campus tend to be more positive when the student body on campus is less diverse. The correlation coefficients are +.29 for public and +.35 for private. Scatter plots are located below, along with best-fit lines whose slopes turn out to be +.09 and +.15, respectively.
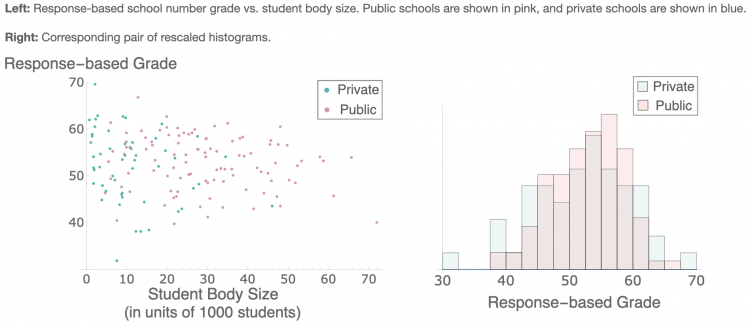
• School grade was found to depend only mildly on student body size alone. In terms of Pearson correlation coefficients, the set of private schools yielded a coefficient of -0.27, and that of public schools yielded a value of -0.18. A negative correlation coefficient indicates that an increase in one variable—in this case, student body size—is associated statistically with a decrease in the other—in this case, school grade. The smallest magnitude that a correlation coefficient can take is zero (no detectable linear dependence between the two variables), and the maximum magnitude that it can take is one (perfect correlation, i.e., data points fall exactly on a line when one variable is plotted against the other).
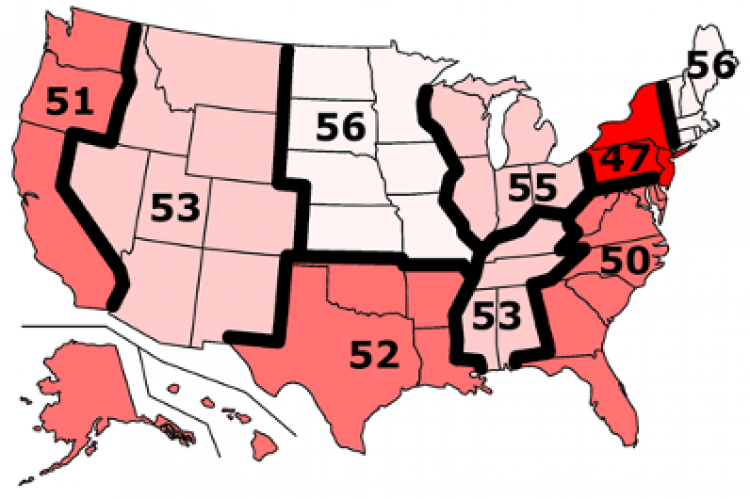
• Sets of schools grouped by census region had average scores and standard deviations that were comparable. See the map and table below, showing that the mean score by region was tightly clustered from 47 to 56, with the Middle Atlantic region scoring lowest while New England and the West North Central region scored the highest, on average.
|
Census Region |
Average Score |
Standard Deviation |
Number of Schools |
|
East North Central |
55 |
6.2 |
32 |
|
West North Central |
56 |
6.0 |
18 |
|
East South Central |
53 |
7.3 |
13 |
|
New England |
56 |
5.2 |
7 |
|
Middle Atlantic |
47 |
8.0 |
14 |
|
Mountain |
53 |
4.7 |
9 |
|
Pacific |
51 |
6.0 |
16 |
|
South Atlantic |
50 |
5.0 |
28 |
|
West South Central |
52 |
5.6 |
16 |
About RealClearEducation
RealClearEducation is dedicated to providing readers with better, more insightful analysis of the most important news and education policy issues of the day. RealClearEducation is part of the RealClear Media Group, which includes RealClearPolitics and more than a dozen other news websites. RealClear’s daily editorial curation, public opinion analysis, and original reporting present balanced, nonpartisan news coverage that empowers readers to stay informed.
For more information, visit RealClearEducation.com.
About Slingshot
Slingshot Strategies is a polling and consulting firm based in New York City. Slingshot has worked with campaigns, nonprofits, and other groups to develop dynamic data-driven answers to complicated questions and challenges. We conduct tailored research initiatives for political campaigns, independent expenditures, nonprofits, think tanks, and issue advocacy organizations, with a focus on understudied and difficult-to-reach audiences.
Slingshot Strategies offers sophisticated polling methodologies that go beyond the limitations of traditional landline-only polling while remaining less expensive and more versatile. Our work includes high-level analysis of polling data to provide deep insights, actionable findings, and sophisticated understanding of patterns and trends.
Detailed Methodology
Students were contacted through e-mail by their national fraternity/sorority organizations and asked whether they would like to participate in a survey about freedom of association and speech on campus. Participation was voluntary and took place after the end of the spring 2020 semester but before the start of the fall 2020 semester. The survey was administered at the height of the COVID-19 pandemic, offering a unique window into student circumstances and sentiment at a moment of distinct challenges for college and university communities.
Students who chose to participate answered a series of questions primarily asking them to express their degree of agreement or disagreement with various statements, or to respond yes or no to simple queries. Each student’s set of responses was translated into a numerical value according to the same formula: +2 points for strongly agree, +1 for somewhat agree, -1 for somewhat disagree, -2 for strongly disagree, +1 for yes, and -1 for no.
Questions were phrased so that the numerical scores assigned to each type of response aligned with desirability. For example, after receiving the prompt “Please indicate whether you agree or disagree with each of the following statements,” the sentence “My fraternity or sorority is treated fairly by campus administrators,” from the Greek Fairness section, or “Students on my campus are free to host events, speakers, and member activities without interference from the administration or other students,” from the Organizational Freedoms section, would be followed by choices of “strongly agree,” “somewhat agree,” “somewhat disagree,” and “strongly disagree.” Those responses were then translated into numerical values according to the prescription described above.
For each school, the set of student response values for a given question was averaged. This was done for each question individually for the school, and the set of average question-scores for the school was summed. This “simple score” was transformed into a value from 0 to 100 by shifting the set of simple scores by the minimum score possible (which would reflect a school that does the worst possible on every question); and rescaling each one by the maximum range of simple scores (the difference in score between a school that performs the best possible on every issue and one that performs the worst possible on every issue). The resulting ratio for each school is a value from 0 to 1. We refer to this ratio as a school’s “number grade,” when expressed as a percentage, similar to a student’s performance on a test or paper.
Additionally, a few questions focus on student circumstances and behaviors and involved choosing from a list of options or ranking issues based on importance. These did not factor into school scores but do provide interesting insights into student life during the COVID-19 pandemic.
Finally, for schools from which 10 or more students participated in the survey, number grades were translated into letter grades. These are discussed in the penultimate section, “Letter Grade Rankings.”
Detailed Question Analysis
All survey questions pertaining to free speech on college campuses are reprinted below. Questions are broken up by section (Greek Fairness, Organizational Freedoms, and Personal Freedoms) and appear in the order in which they were displayed to students in the online survey. The available responses for each question are shown, along with the percentage of all students who selected each response. Results paint a mixed picture of the issue. Here we highlight a subset of particularly interesting results.
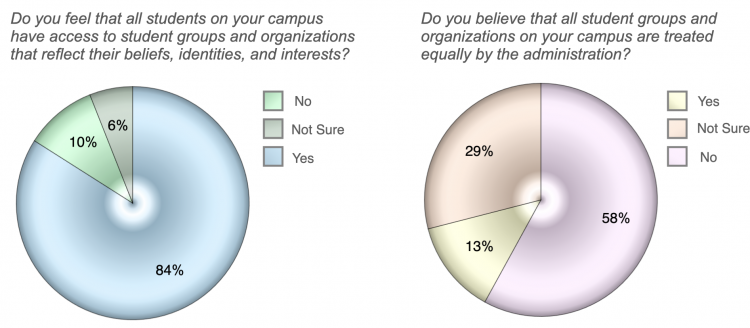
Generally, the ability to organize (whether in student groups, or fraternities and sororities) tends to receive a positive evaluation by students. Students who feel that undue restrictions or impediments are placed on groups constitute a minority. For example, 84% of students responded yes to the question
“Do you feel that all students on your campus have access to student groups and organizations that reflect their beliefs, identities, and interests?”
On the subject of fairness, however, students drew a distinction between how their fraternities and sororities are treated by the administration vs. how student groups writ-large are treated. For example, 58% of students responded no to the question
“Do you believe that all student groups and organizations on your campus are treated equally by the administration?”
compared with only 13% who responded yes (29% said that they were not sure).
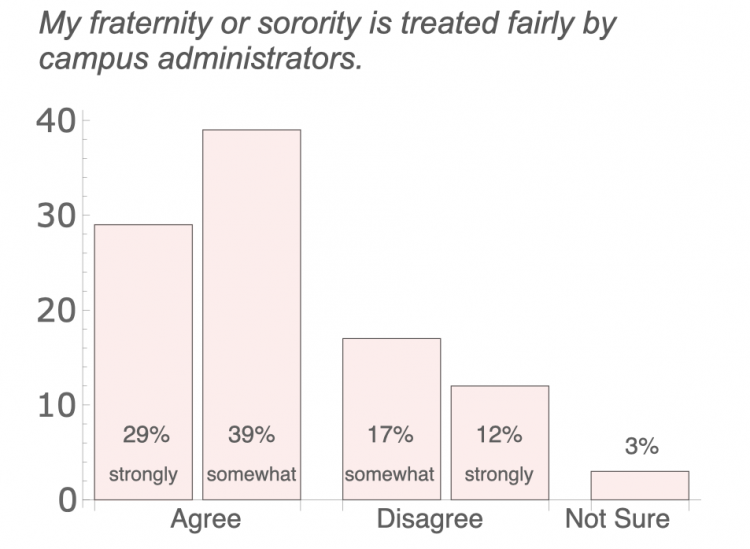
Yet a large majority of students (68%) agreed with the statement
“My fraternity or sorority is treated fairly by campus administrators”
compared with only 29% who disagreed.
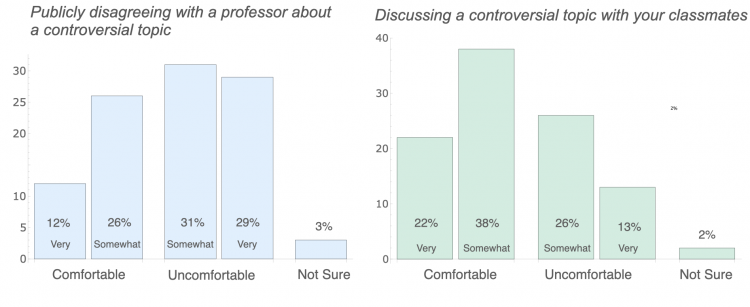
Feelings on personal freedoms were also a mixed bag. For instance, when asked whether they would feel comfortable publicly disagreeing with a professor about a controversial topic, students split 38% comfortable vs. 60% uncomfortable. However, when asked how they felt about discussing a controversial topic with their classmates, the split was the reverse: 60% comfortable vs. 39% uncomfortable.
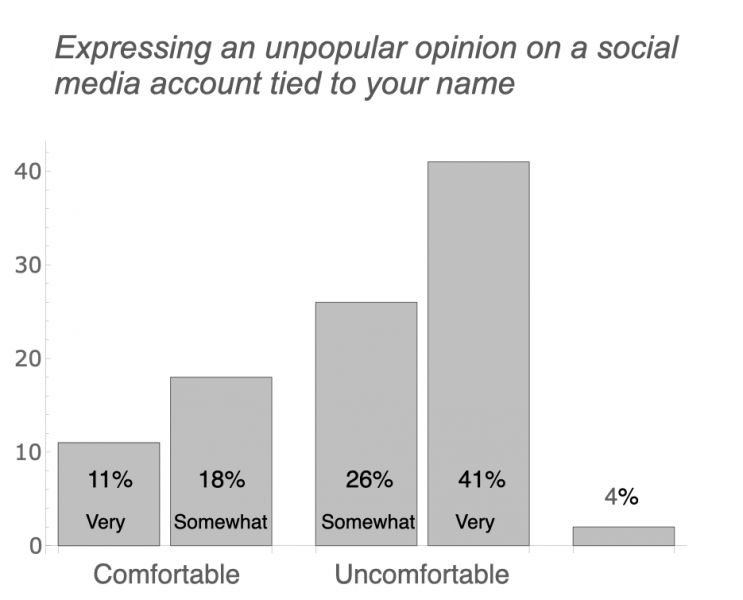
The scenario that elicited the most discomfort was “expressing an unpopular opinion on social media tied to your name.”
It is interesting to contemplate whether these differences are more a reflection of Gen Z’s particular characteristics and concerns, compared with millennials and older generations, or whether they represent a meaningful change in the culture or climate on college campuses.
Greek Fairness
• Please indicate how you believe that the following organizations and people are generally viewed on your campus.
Fraternities
ALL RESPONDENTS
TOTAL FAVORABLE 57%
TOTAL UNFAVORABLE 41%
Very favorable 12%
Somewhat favorable 45%
Somewhat unfavorable 32%
Very unfavorable 9%
Not sure 2%
FRATERNITY MEMBERS
TOTAL FAVORABLE 62%
TOTAL UNFAVORABLE 37%
Very favorable 15%
Somewhat favorable 47%
Somewhat unfavorable 28%
Very unfavorable 9%
Not sure 1%
SORORITY MEMBERS
TOTAL FAVORABLE 54%
TOTAL UNFAVORABLE 43%
Very favorable 10%
Somewhat favorable 44%
Somewhat unfavorable 34%
Very unfavorable 9%
Not sure 3%
Sororities
ALL RESPONDENTS
TOTAL FAVORABLE 76%
TOTAL UNFAVORABLE 22%
Very favorable 21%
Somewhat favorable 55%
Somewhat unfavorable 19%
Very unfavorable 3%
Not sure 2%
FRATERNITY MEMBERS
TOTAL FAVORABLE 73%
TOTAL UNFAVORABLE 23%
Very favorable 22%
Somewhat favorable 51%
Somewhat unfavorable 19%
Very unfavorable 4%
Not sure 4%
SORORITY MEMBERS
TOTAL FAVORABLE 78%
TOTAL UNFAVORABLE 20%
Very favorable 20%
Somewhat favorable 58%
Somewhat unfavorable 18%
Very unfavorable 2%
Not sure 2%
Please indicate whether you agree or disagree with each of the following statements:
• My fraternity or sorority is treated fairly by campus administrators.
ALL RESPONDENTS
TOTAL AGREE 68%
TOTAL DISAGREE 29%
Strongly agree 29%
Somewhat agree 39%
Somewhat disagree 17%
Strongly disagree 12%
Not sure 3%
FRATERNITY MEMBERS
TOTAL AGREE 57%
TOTAL DISAGREE 42%
Strongly agree 20%
Somewhat agree 37%
Somewhat disagree 22%
Strongly disagree 20%
Not sure 1%
SORORITY MEMBERS
TOTAL AGREE 76%
TOTAL DISAGREE 42%
Strongly agree 21%
Somewhat agree 41%
Somewhat disagree 14%
Strongly disagree 7%
Not sure 4%
• There is no pressure on my campus for fraternities and sororities to become co-ed.
ALL RESPONDENTS
TOTAL AGREE 75%
TOTAL DISAGREE 9%
Strongly agree 59%
Somewhat agree 16%
Somewhat disagree 6%
Strongly disagree 3%
Not sure 16%
FRATERNITY MEMBERS
TOTAL AGREE 73%
TOTAL DISAGREE 12%
Strongly agree 55%
Somewhat agree 18%
Somewhat disagree 8%
Strongly disagree 4%
Not sure 15%
SORORITY MEMBERS
TOTAL AGREE 77%
TOTAL DISAGREE 7%
Strongly agree 61%
Somewhat agree 15%
Somewhat disagree 4%
Strongly disagree 3%
Not sure 16%
• There is no pressure on my campus for fraternities and sororities to be kicked off campus.
ALL RESPONDENTS
TOTAL AGREE 45%
TOTAL DISAGREE 49%
Strongly agree 22%
Somewhat agree 23%
Somewhat disagree 27%
Strongly disagree 22%
Not sure 5%
FRATERNITY MEMBERS
TOTAL AGREE 39%
TOTAL DISAGREE 58%
Strongly agree 18%
Somewhat agree 21%
Somewhat disagree 29%
Strongly disagree 29%
Not sure 3%
SORORITY MEMBERS
TOTAL AGREE 51%
TOTAL DISAGREE 43%
Strongly agree 26%
Somewhat agree 25%
Somewhat disagree 26%
Strongly disagree 17%
Not sure 6%
• I’m confident in the future of fraternities and sororities on my campus.
ALL RESPONDENTS
TOTAL AGREE 62%
TOTAL DISAGREE 35%
Strongly agree 30%
Somewhat agree 32%
Somewhat disagree 20%
Strongly disagree 15%
Not sure 3%
FRATERNITY MEMBERS
TOTAL AGREE 54%
TOTAL DISAGREE 42%
Strongly agree 25%
Somewhat agree 29%
Somewhat disagree 22%
Strongly disagree 20%
Not sure 4%
SORORITY MEMBERS
TOTAL AGREE 67%
TOTAL DISAGREE 30%
Strongly agree 34%
Somewhat agree 33%
Somewhat disagree 19%
Strongly disagree 11%
Not sure 3%
Organizational Freedoms
Now you’re going to be asked some questions about student organizations on your campus. Please answer them to the best of your ability.
• Do student organizations on your campus have the right to consider sex or gender identity in their membership criteria?
ALL RESPONDENTS
Yes 42%
No 12%
Not sure 46%
FRATERNITY MEMBERS
Yes 48%
No 11%
Not sure 41%
SORORITY MEMBERS
Yes 38%
No 12%
Not sure 50%
• Does your campus apply special regulations or restrictions to single-sex organizations, such as fraternities and sororities, that are not applied to other student organizations?
ALL RESPONDENTS
Yes 35%
No 14%
Not sure 52%
FRATERNITY MEMBERS
Yes 37%
No 16%
Not sure 47%
SORORITY MEMBERS
Yes 33%
No 12%
Not sure 55%
• Do you feel that all students on your campus have access to student groups and organizations that reflect their beliefs, identities, and interests?
ALL RESPONDENTS
Yes 84%
No 10%
Not sure 6%
FRATERNITY MEMBERS
Yes 86%
No 9%
Not sure 5%
SORORITY MEMBERS
Yes 82%
No 11%
Not sure 7%
• Do you feel that all student groups and organizations on your campus are treated equally by the administration?
ALL RESPONDENTS
Yes 29%
No 58%
Not sure 13%
FRATERNITY MEMBERS
Yes 28%
No 62%
Not sure 10%
SORORITY MEMBERS
Yes 29%
No 55%
Not sure 16%
• On your campus, if one member of a student organization is accused of misconduct or something illegal, how often is the entire student organization punished, suspended, or banned?
ALL RESPONDENTS
Very often 28%
Sometimes 36%
Rarely 16%
Never 3%
Not sure 17%
FRATERNITY MEMBERS
Very often 36%
Sometimes 36%
Rarely 12%
Never 3%
Not sure 13%
SORORITY MEMBERS
Very often 22%
Sometimes 36%
Rarely 19%
Never 4%
Not sure 19%
Please indicate whether you agree or disagree with each of the following statements.
• Student organizations on my campus are free to determine their own membership, values, and mission without interference from the administration or other students.
ALL RESPONDENTS
TOTAL AGREE 72%
TOTAL DISAGREE 22%
Strongly agree 24%
Somewhat agree 48%
Somewhat disagree 16%
Strongly disagree 6%
Not sure 6%
FRATERNITY MEMBERS
TOTAL AGREE 71%
TOTAL DISAGREE 24%
Strongly agree 26%
Somewhat agree 45%
Somewhat disagree 16%
Strongly disagree 8%
Not sure 5%
SORORITY MEMBERS
TOTAL AGREE 71%
TOTAL DISAGREE 20%
Strongly agree 22%
Somewhat agree 49%
Somewhat disagree 15%
Strongly disagree 5%
Not sure 9%
• Student organizations on my campus are free to host events, speakers, and member activities without interference from the administration or other students.
ALL RESPONDENTS
TOTAL AGREE 56%
TOTAL DISAGREE 38%
Strongly agree 17%
Somewhat agree 39%
Somewhat disagree 22%
Strongly disagree 16%
Not sure 6%
FRATERNITY MEMBERS
TOTAL AGREE 52%
TOTAL DISAGREE 43%
Strongly agree 16%
Somewhat agree 36%
Somewhat disagree 23%
Strongly disagree 20%
Not sure 5%
SORORITY MEMBERS
TOTAL AGREE 59%
TOTAL DISAGREE 34%
Strongly agree 18%
Somewhat agree 41%
Somewhat disagree 21%
Strongly disagree 12%
Not sure 7%
Personal Freedoms
Some students say that it can be difficult to have conversations about certain issues on campus. Which of the following issues, if any, would you say are difficult to have an open and honest conversation about on your campus? [select all that apply]
|
Race |
55% |
|
Abortion |
54% |
|
Gun control |
53% |
|
Transgender issues |
52% |
|
Immigration |
46% |
|
Feminism |
39% |
|
Religion |
39% |
|
Affirmative action |
35% |
|
The Israeli/Palestinian conflict |
34% |
|
None of the above |
22% |
How comfortable would you feel doing the following on your campus:
• Publicly disagreeing with a professor about a controversial topic
TOTAL COMFORTABLE 38%
TOTAL UNCOMFORTABLE 60%
Very comfortable 12%
Somewhat comfortable 26%
Somewhat uncomfortable 31%
Very uncomfortable 29%
Not sure 3%
• Expressing an unpopular opinion on a social media account tied to your name
TOTAL COMFORTABLE 29%
TOTAL UNCOMFORTABLE 67%
Very comfortable 11%
Somewhat comfortable 18%
Somewhat uncomfortable 26%
Very uncomfortable 41%
Not sure 4%
• Discussing a controversial political topic with your classmates
TOTAL COMFORTABLE 60%
TOTAL UNCOMFORTABLE 39%
Very comfortable 22%
Somewhat comfortable 38%
Somewhat uncomfortable 26%
Very uncomfortable 13%
Not sure 2%
• Writing an article or letter in the student newspaper that is critical of the college administration
TOTAL COMFORTABLE 42%
TOTAL UNCOMFORTABLE 49%
Very comfortable 16%
Somewhat comfortable 26%
Somewhat uncomfortable 25%
Very uncomfortable 24%
Not sure 8%
• Does your college administration make it clear to students that free speech is protected on your campus?
Yes 53%
No 26%
Not sure 21%
• If a controversy over offensive speech were to occur on your campus, would the administration be more likely to...
Defend the speaker’s right to express his/her views 23%
Punish the speaker for making the statement 38%
Not sure 39%
• Have you personally ever felt that you could not express your opinion on a subject because of how students, a professor, or the administration would respond?
Yes 50%
No 42%
Not sure 9%
• Using a seven-point scale, from extremely liberal (point 1) to extremely conservative (point 7), where would you place yourself on this scale?
TOTAL LIBERAL 46%
TOTAL CONSERVATIVE 33%
Extremely liberal 9%
Liberal 22%
Slightly liberal 15%
Moderate 21%
Slightly conservative 14%
Conservative 16%
Extremely conservative 3%
Letter Grade Rankings
We assigned a letter grade to all schools from which 10 or more students participated in the survey (which turned out to be 153 schools). Letter grades were first assigned according to the following intervals:
|
Number Grade |
Uncurved Letter Grade |
|
0% |
F |
|
65% |
D |
|
67% |
D+ |
|
70% |
C- |
|
73% |
C |
|
77% |
C+ |
|
80% |
B- |
|
83% |
B |
|
87% |
B+ |
|
90% |
A- |
|
93% |
A |
|
97% |
A+ |
According to the standard above, virtually every school would receive an F (two would not: Rose-Hulman Institute of Technology; and North Dakota State University–Main Campus, which receive D+ and D, respectively). It is important to bear in mind that a score of 50% corresponds to a school where opinions on campus free speech are exactly balanced between positive and negative evaluations, when strong opinions (strongly agree/disagree) are taken to count twice as much as mild opinions (somewhat agree/disagree). A score of 100% corresponds to a school from which every respondent was not merely satisfied with how free speech is handled but where all respondents were maximally positive/optimistic in their evaluation. Similarly, a score of 0% corresponds to a school where all respondents were as negative as possible in their responses.
Curved letter grades were introduced for the purpose of allowing easy comparison between schools, and they simply reflect a school’s ranking among its peers. This was done to illustrate relative positive or negative performance in the context of the wider college experience, rather than indicate especially poor or exemplary practices on any single campus. Schools were arranged in order of descending number grade: the top 13 were deemed “A+”; the subsequent 13 “A”; the following 13 “A-”; and so on, until the bottom of the list was reached.
A full table of curved letter rankings can be found below:
|
School |
Curved Letter Grade |
|
ROSE-HULMAN INSTITUTE OF TECHNOLOGY |
A+ |
|
NORTH DAKOTA STATE UNIVERSITY–MAIN CAMPUS |
A+ |
|
OHIO NORTHERN UNIVERSITY |
A+ |
|
WESTERN KENTUCKY UNIVERSITY |
A+ |
|
SACRED HEART UNIVERSITY (MA) |
A+ |
|
QUINNIPIAC UNIVERSITY |
A+ |
|
KETTERING UNIVERSITY |
A+ |
|
RIPON COLLEGE |
A+ |
|
EAST STROUDSBURG UNIVERSITY OF PENNSYLVANIA |
A+ |
|
UNIVERSITY OF COLORADO–BOULDER |
A+ |
|
ROCHESTER INSTITUTE OF TECHNOLOGY |
A+ |
|
IOWA STATE UNIVERSITY |
A |
|
NEBRASKA WESLEYAN UNIVERSITY |
A |
|
UNIVERSITY OF WASHINGTON–SEATTLE |
A |
|
MIAMI UNIVERSITY–OXFORD |
A |
|
UNIVERSITY OF LOUISVILLE |
A |
|
KENT STATE UNIVERSITY–KENT |
A |
|
BOWLING GREEN STATE UNIVERSITY–MAIN CAMPUS |
A |
|
BUTLER UNIVERSITY |
A |
|
UNIVERSITY OF NORTH DAKOTA |
A |
|
BOISE STATE UNIVERSITY |
A |
|
MISSOURI STATE UNIVERSITY–SPRINGFIELD |
A |
|
SOUTHEAST MISSOURI STATE UNIVERSITY |
A- |
|
CENTRE COLLEGE |
A- |
|
UNIVERSITY OF NEBRASKA–LINCOLN |
A- |
|
WESTERN MICHIGAN UNIVERSITY |
A- |
|
UNIVERSITY OF DELAWARE |
A- |
|
OHIO WESLEYAN UNIVERSITY |
A- |
|
NORTHEASTERN UNIVERSITY |
A- |
|
TEXAS TECH UNIVERSITY |
A- |
|
MINNESOTA STATE UNIVERSITY–MANKATO |
A- |
|
WASHINGTON STATE UNIVERSITY |
A- |
|
UNIVERSITY OF ALABAMA |
A- |
|
LOYOLA UNIVERSITY–CHICAGO |
A- |
|
UNIVERSITY OF TEXAS–DALLAS |
B+ |
|
UNIVERSITY OF CALIFORNIA–LOS ANGELES |
B+ |
|
GEORGIA INSTITUTE OF TECHNOLOGY–MAIN CAMPUS |
B+ |
|
UNIVERSITY OF AKRON–MAIN CAMPUS |
B+ |
|
UNIVERSITY OF SOUTH DAKOTA |
B+ |
|
MASSACHUSETTS INSTITUTE OF TECHNOLOGY |
B+ |
|
HANOVER COLLEGE |
B+ |
|
UNIVERSITY OF OREGON |
B+ |
|
LOYOLA MARYMOUNT UNIVERSITY |
B+ |
|
UNIVERSITY OF MINNESOTA–TWIN CITIES |
B+ |
|
UNIVERSITY OF WISCONSIN–MADISON |
B+ |
|
MICHIGAN STATE UNIVERSITY |
B+ |
|
UNIVERSITY OF MISSOURI–KANSAS CITY |
B |
|
UNIVERSITY OF ALABAMA–HUNTSVILLE |
B |
|
UNIVERSITY OF IDAHO |
B |
|
UNIVERSITY OF CENTRAL ARKANSAS |
B |
|
TEXAS CHRISTIAN UNIVERSITY |
B |
|
BRADLEY UNIVERSITY |
B |
|
AUBURN UNIVERSITY |
B |
|
UNIVERSITY OF OKLAHOMA–NORMAN |
B |
|
UNIVERSITY OF CENTRAL OKLAHOMA |
B |
|
UNIVERSITY OF KANSAS |
B |
|
BAYLOR UNIVERSITY |
B |
|
COLORADO SCHOOL OF MINES |
B |
|
OREGON STATE UNIVERSITY |
B- |
|
UNIVERSITY OF KENTUCKY |
B- |
|
UNIVERSITY OF MARYLAND–COLLEGE PARK |
B- |
|
MURRAY STATE UNIVERSITY |
B- |
|
STETSON UNIVERSITY |
B- |
|
KANSAS STATE UNIVERSITY |
B- |
|
UNIVERSITY OF VIRGINIA–MAIN CAMPUS |
B- |
|
UNIVERSITY OF TAMPA |
B- |
|
SOUTHERN METHODIST UNIVERSITY |
B- |
|
UNIVERSITY OF CINCINNATI–MAIN CAMPUS |
B- |
|
UNIVERSITY OF GEORGIA |
B- |
|
UNIVERSITY OF FLORIDA |
B- |
|
UNIVERSITY OF NORTH CAROLINA–CHARLOTTE |
C+ |
|
ADRIAN COLLEGE |
C+ |
|
BOSTON UNIVERSITY |
C+ |
|
TEXAS A&M UNIVERSITY–COLLEGE STATION |
C+ |
|
NORTHWESTERN UNIVERSITY |
C+ |
|
PEPPERDINE UNIVERSITY |
C+ |
|
TULANE UNIVERSITY |
C+ |
|
UNIVERSITY OF NORTH FLORIDA |
C+ |
|
ARIZONA STATE UNIVERSITY–TEMPE |
C+ |
|
FLORIDA INTERNATIONAL UNIVERSITY |
C+ |
|
SUNY–GENESEO |
C+ |
|
OKLAHOMA STATE UNIVERSITY–MAIN CAMPUS |
C+ |
|
UNIVERSITY OF ARIZONA |
C |
|
UNIVERSITY OF ILLINOIS–URBANA-CHAMPAIGN |
C |
|
UNIVERSITY OF CHICAGO |
C |
|
FLORIDA SOUTHERN COLLEGE |
C |
|
UNIVERSITY OF MISSISSIPPI |
C |
|
UNIVERSITY OF CALIFORNIA–BERKELEY |
C |
|
WOFFORD COLLEGE |
C |
|
CASE WESTERN RESERVE UNIVERSITY |
C |
|
UNIVERSITY OF SOUTH CAROLINA–COLUMBIA |
C |
|
NORTH CAROLINA STATE UNIVERSITY–RALEIGH |
C |
|
LOUISIANA STATE UNIVERSITY AND AGRICULTURAL & MECHANICAL COLLEGE |
C |
|
UNIVERSITY OF CONNECTICUT |
C |
|
DEPAUW UNIVERSITY |
C- |
|
UNIVERSITY OF NEVADA–RENO |
C- |
|
INDIANA UNIVERSITY–BLOOMINGTON |
C- |
|
COLLEGE OF CHARLESTON |
C- |
|
UNIVERSITY OF SOUTH FLORIDA–MAIN CAMPUS |
C- |
|
CLEMSON UNIVERSITY |
C- |
|
CALIFORNIA STATE UNIVERSITY–FRESNO |
C- |
|
VIRGINIA POLYTECHNIC INSTITUTE AND STATE UNIVERSITY |
C- |
|
UNIVERSITY OF THE PACIFIC |
C- |
|
OHIO UNIVERSITY–MAIN CAMPUS |
C- |
|
GRAND VALLEY STATE UNIVERSITY |
C- |
|
SHIPPENSBURG UNIVERSITY |
C- |
|
ELON UNIVERSITY |
D+ |
|
RUTGERS UNIVERSITY–NEW BRUNSWICK |
D+ |
|
UNIVERSITY OF MASSACHUSETTS–AMHERST |
D+ |
|
PURDUE UNIVERSITY–MAIN CAMPUS |
D+ |
|
UNIVERSITY OF IOWA |
D+ |
|
COLORADO STATE UNIVERSITY–FORT COLLINS |
D+ |
|
UNIVERSITY OF TEXAS–AUSTIN |
D+ |
|
UNIVERSITY OF MISSOURI–COLUMBIA |
D+ |
|
ALLEGHENY COLLEGE |
D+ |
|
GEORGE WASHINGTON UNIVERSITY |
D+ |
|
UNIVERSITY OF TULSA |
D+ |
|
COLLEGE OF WILLIAM & MARY |
D+ |
|
UNIVERSITY OF PENNSYLVANIA |
D |
|
UNIVERSITY OF CALIFORNIA–DAVIS |
D |
|
ILLINOIS STATE UNIVERSITY |
D |
|
DRAKE UNIVERSITY |
D |
|
UNIVERSITY OF ALABAMA–BIRMINGHAM |
D |
|
UNIVERSITY OF NORTHERN COLORADO |
D |
|
UNIVERSITY OF SAN DIEGO |
D |
|
TRUMAN STATE UNIVERSITY |
D |
|
FLORIDA STATE UNIVERSITY |
D |
|
WAKE FOREST UNIVERSITY |
D |
|
OHIO STATE UNIVERSITY–MAIN CAMPUS |
D |
|
CALIFORNIA POLYTECHNIC STATE UNIVERSITY–SAN LUIS OBISPO |
D |
|
PENNSYLVANIA STATE UNIVERSITY–MAIN CAMPUS |
D- |
|
CREIGHTON UNIVERSITY |
D- |
|
BALL STATE UNIVERSITY |
D- |
|
UNIVERSITY OF TENNESSEE–KNOXVILLE |
D- |
|
BUCKNELL UNIVERSITY |
D- |
|
AMERICAN UNIVERSITY |
D- |
|
BELMONT UNIVERSITY |
D- |
|
CENTRAL MICHIGAN UNIVERSITY |
D- |
|
UNIVERSITY OF SOUTHERN CALIFORNIA |
D- |
|
UNIVERSITY OF MICHIGAN–ANN ARBOR |
D- |
|
UNIVERSITY OF PITTSBURGH–PITTSBURGH CAMPUS |
D- |
|
SAN DIEGO STATE UNIVERSITY |
D- |
|
CALIFORNIA STATE UNIVERSITY–FULLERTON |
F |
|
CORNELL UNIVERSITY |
F |
|
SYRACUSE UNIVERSITY |
F |
|
UNIVERSITY OF NORTH CAROLINA–CHAPEL HILL |
F |
|
NORTHEASTERN STATE UNIVERSITY |
F |
|
UNIVERSITY OF CENTRAL FLORIDA |
F |
|
SAM HOUSTON STATE UNIVERSITY |
F |
|
DUKE UNIVERSITY |
F |
|
UNIVERSITY OF ROCHESTER |
F |
|
VANDERBILT UNIVERSITY |
F |
|
RENSSELAER POLYTECHNIC INSTITUTE |
F |
To view the data and number grade for all 534 colleges and universities included in our survey, download a PDF copy of the full report.